


#138: Cold Streams and Cooling Markets
Reflections from Korea as BTC Tests Its Ceiling

Wrapping up Korea soon. Chilled out in a pool on the side of a stream filled by a mountain top waterfall. Was super cold and felt great on a break during a long hike.

How many Wall Street bulls are there?

“Full of anticipation” watching how this market is progressing.
📌 TL;DR / Smurf’s Summary
Bitcoin's bullish momentum has decreased following its failed breakout from $105K, with caution warranted as bearish divergence signals emerge. Support now sits at $95.7K-$98.3K, with resistance at $107K-$110K. The daily structure remains bullish despite short-term bearish momentum; however, a daily close below $92K could signal bullish invalidation. The ETH & ALT rotation has played out; focus remains on only "ideal" breakout setups with tight stops. With bearish divergence targets for BTC around $99.7K, the market enters a critical period, while we enter a potential topping window around May 18-23 that could precede a transition to bear market conditions.
🚦 Trader Traffic Light

BTC Trades: 🟠
Amber Light. The breakout from $105K ultimately failed. I missed it anyway, I was asleep. Bullish momentum has decreased from last week. At this point, I’d consider a breakout trade if we start trading over the All-Time High (ATH).
ETH & ALTs Trades: 🟠
Amber Light. I’m still not looking for dip buys. The ALT rotation has played out. I’m only focusing on “ideal” setups and not chasing plays. I’m still keeping a close eye on the altcoin market cap here. Ideally, these setups come into play when the BTC and Stables lines are going down.
🔍 Where Are We Now?
Market Structure: Bullish daily structure, short-term bearish momentum.
Retail Sentiment: Highly Bullish, on decline from Extreme Greed.
Current Positioning:
BTC spot long at $78K, mostly scaled out with 33% remaining on trailing stop (trimmed profit: 1st @ $91.5K, 2nd @ $95.8K, 3rd @ $103.5K).
Few remaining open positions on trailing stops. Evaluating a few ALT breakout trades with tight stops, but only an ideal setup.
What are the Technicals?
Definitions you may not know:
Weekly Closing Range: Created with Bayesian statistics and linear regression. More on that here.
RSI (Relative Strength Index): Momentum indicator showing speed and power of price action.
Divergence: When price action is going one way but momentum is going the other, suggesting the current price trend might be losing power.
📈 Technical Deep Dive (BTC)

Price Action: Bullish Bias, yet stalling.
Support zone at $95.7K-$98.3K; Resistance zone near all-time high $107 - $110K.
Weekly Closing Range is forecasted at $100.4 - $107.1K by Sunday.
Correctly projected 15 out of 29 (51.7% efficiency)
Indicators & Oscillators:
RSI: Suggesting a bullish momentum peak and/or price consolidation range formation because measurements are:
Currently above midline - momentum is generally bullish, it’s easier to go up than down.
Closed below adaptive top band - bullish impulsive action has ceased with a failed momentum breakout from the $105K ceiling.
Divergence Signals: Bearish divergence trades are confirmed with targets around $99.7K and $96.5K. The initial target has confluence with a support level. This may present as a swing low buy opportunity but monitoring momentum will be critical in the moment as market cycle timing would suggest the potential upside is limited and we are going to be working against underlying bearish forces.
📉 Technical Deep Dive (ETH & ALTs)
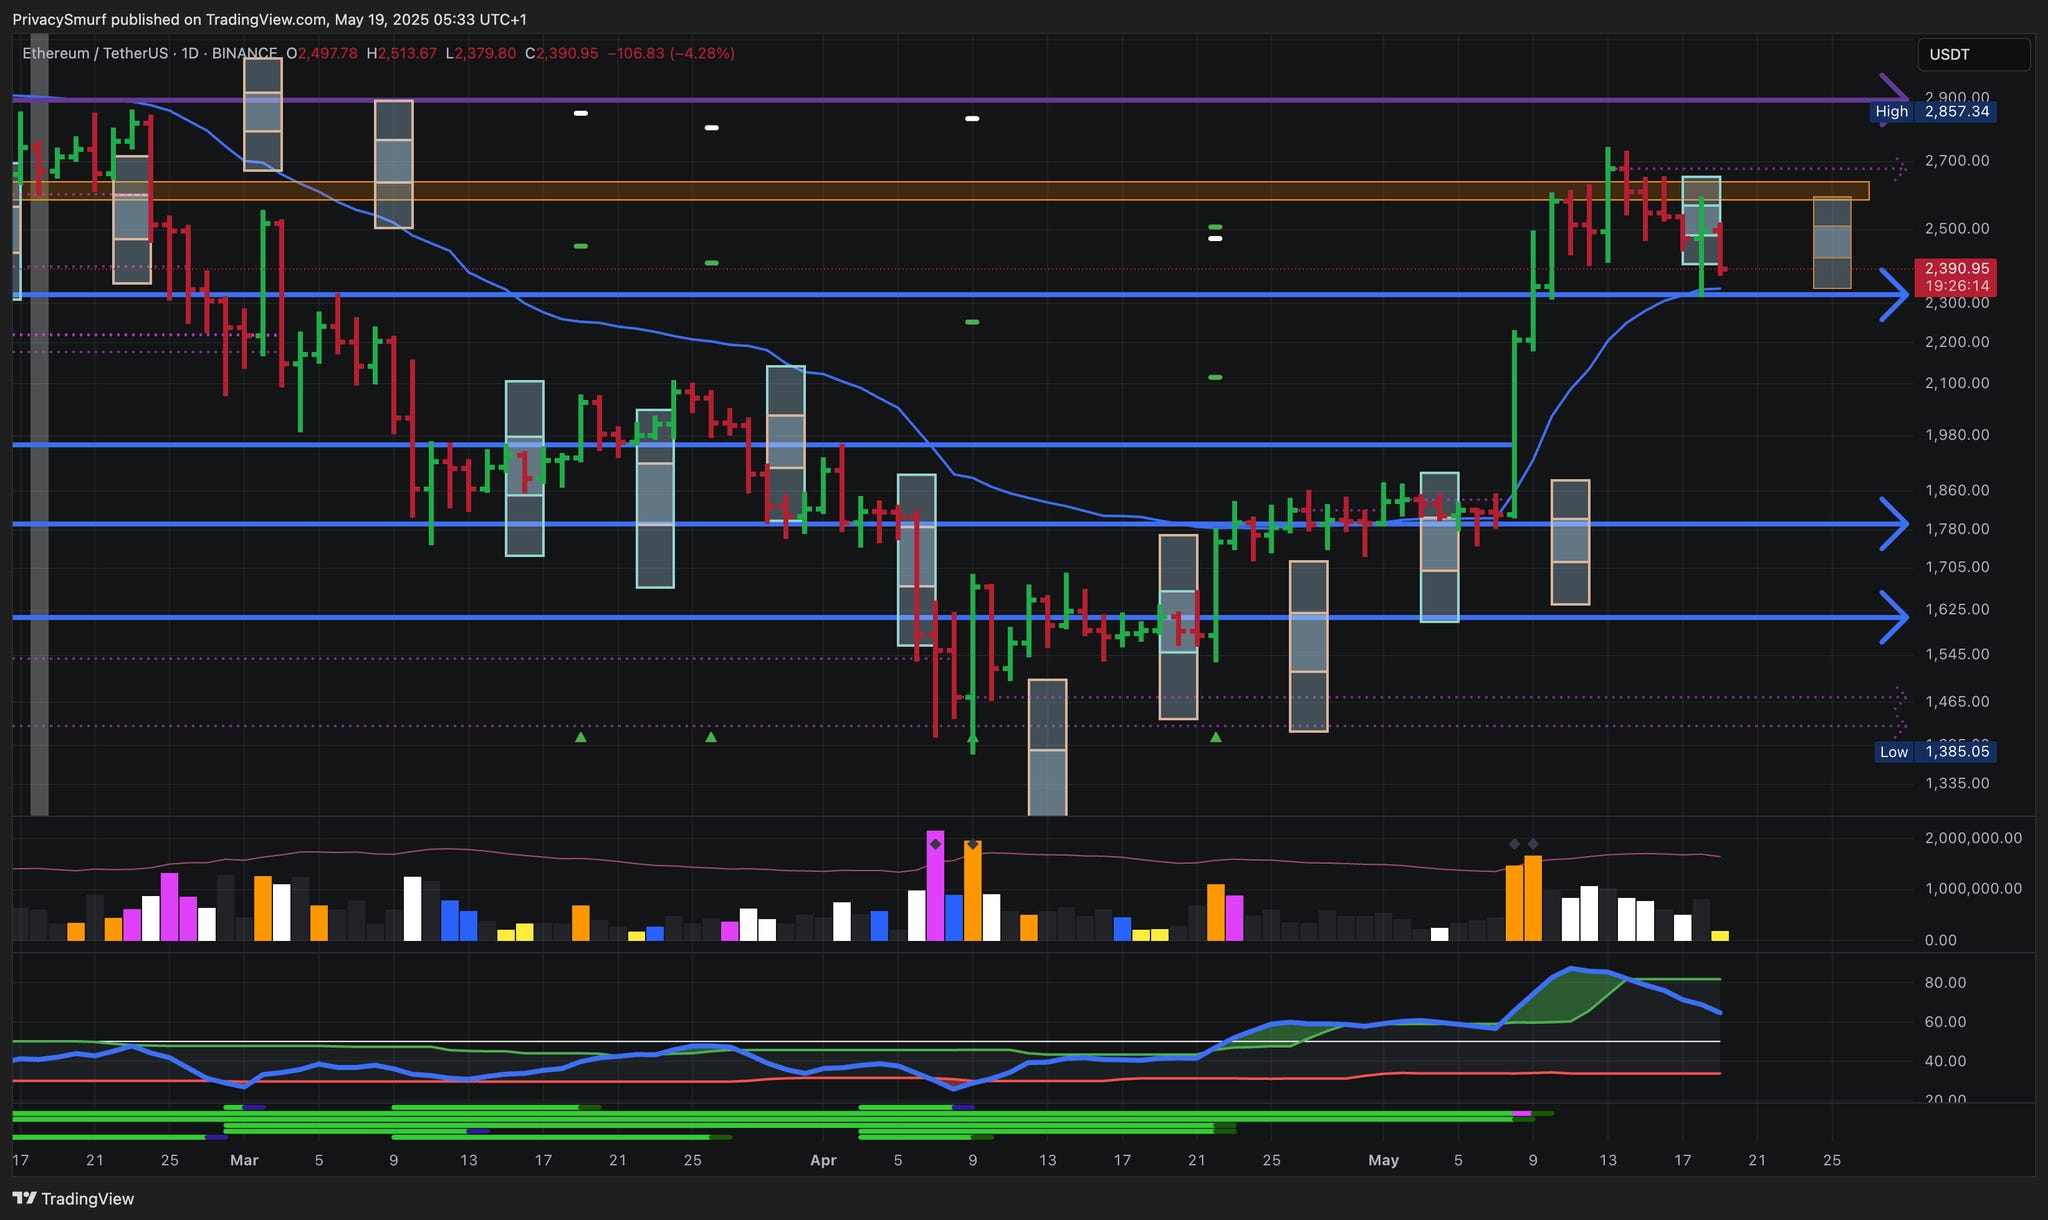
Price Action (ETH): Bullish Bias, yet stalling.
Support at $2320. Resistance zone currently holding at $2585 - $2640 and higher resistance at $2895.
Weekly Closing Range is forecasted at $2340 - $2595 by Sunday.
Correctly projected 13 out of 25 (52% efficiency)
Indicators & Oscillators (ETH):
RSI: Suggesting a bullish momentum peak and/or price consolidation range formation because measurements are:
Currently above midline - momentum is generally bullish, it’s easier to go up than down.
Closed below adaptive top band - bullish impulsive action has ceased with a momentum breakout ceiling at $2680.
Divergence Signals: The confirmed bullish divergence target at 2250 has been hit. The secondary target remain around $2800. With the RSI confirming the momentum ceiling without hitting the secondary target I’m not optimistic about the target being hit in the short term. We are close to a point where I will lean towards it not being hit before we return to deeper lows.
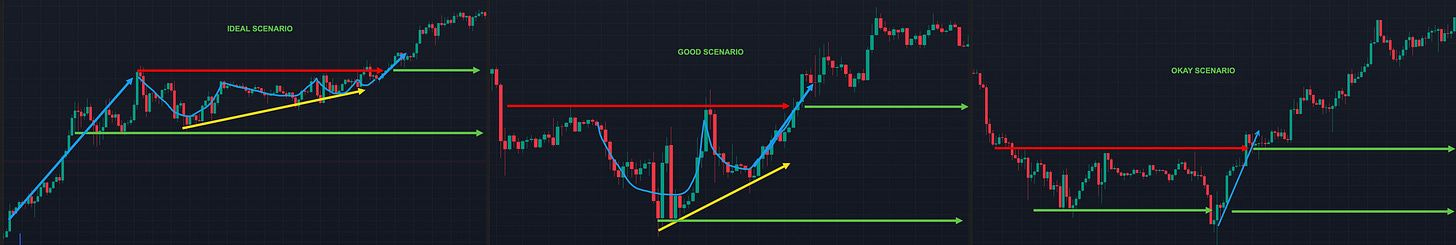
ALTs: The recent Altcoin (ALT) rotation has played itself out as evidenced in my supplemental post here. The opportunities are becoming more risky but they still exist. The focus for breakouts remains on ALTs that have been up trending and are at critical resistance levels. Wait for breakouts that allow for tight stop losses. I’m only considering the “IDEAL” scenarios below given the current market conditions.
🧭 What’s the Plan?
**🧭 Trading Plan & Scenarios**

*   **Bullish - BTC Breakout Continuation:**
    *   Condition: Close > ATH
    *   Action: Eval. new leveraged longs. TP @ 1R to 4R from Stop Loss
*   **Caution - BTC Consolidation:**
    *   Condition: $98K < Daily Closes < $105K & RSI inside bands
    *   Action: Consider short-term range trading, buy support & sell resistnace
*   **Bearish - BTC Bullish Invalidation:**
    *   Condition: Close < $92K
    *   Action: Close short-term spot BTC position
*   **New ALT Rotation:**
    *   Condition: BTC $$ flat or down, BTC.D & Stables cap down, ALT Driver up      *   Action: Evaluate ALT breakouts

---

**📌 Spot Risk Management**

*   **Stop-Losses:**
    *   BTC: Daily close < $74K
    *   ALTs: Placement under clear pivot point ideally < 12% below entry
*   **Position Sizing:**
    *   BTC: Small to moderate entries
    *   ALTs: Small entries
🔮 My Long-Term Market Reflection

Macro Cycle Status:
Bull market still intact, but in a phase that in the past led to bear market confirmation unless we have daily closes above the all-time high, then things get tricky and not so clear-cut. Interestingly, we’ve set a new BTC high close, though that’s also where we fell from last cycle.
Historical Comparison:
Similar patterns to the prior bull market suggest caution; historically, failing to breach all-time highs before turning back down has signaled the onset of a bear market.

Personal Expectations:
As time progresses without setting new highs, we continue to shape the market like the last bull market.
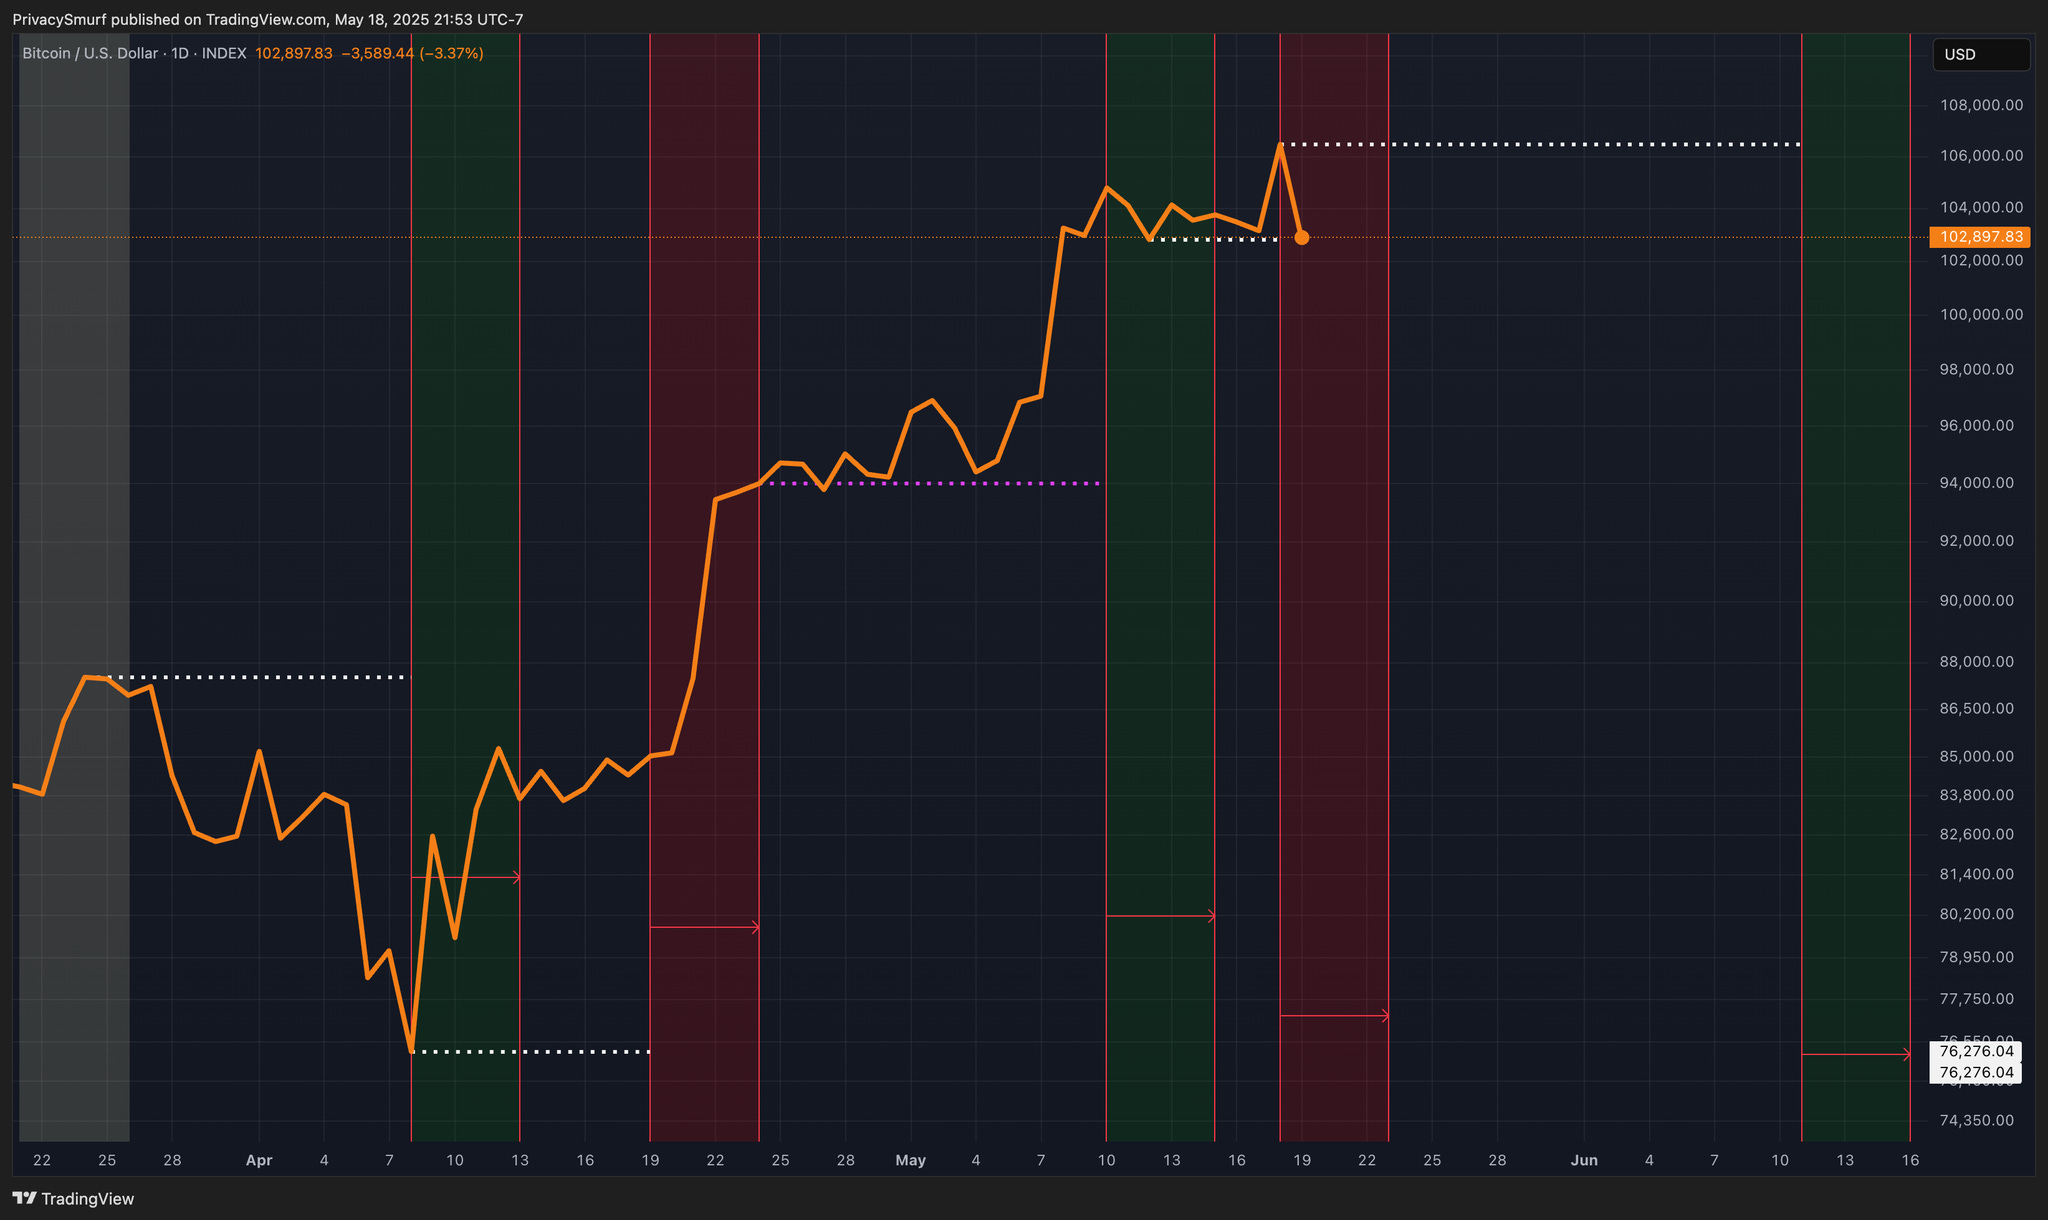
In a perfect mirroring scenario, we would have already hit the lowest low (✅) and initiated a rally (✅), only to establish a macro lower high over the next 2 weeks before transitioning into a bear market. This timeline aligns well with the current peak window on the daily chart, as per the quarterly forecast. Read that here if you haven’t yet.
https://zenalyticstrading.substack.com/p/quarterly-market-synthesis-q2-2025
We have now confirmed a momentum ceiling for the TOTAL & BTC charts with an additional bearish divergence trade signal on the daily timeframe. We are entering a topping timing window for BTC, which spans from May 18 to May 23. In a perfect world, whatever high close we see will be the highest close before the next bottoming timing window from June 11 to June 16.
This is a lot of confluence suggesting that the short term will more than likely not experience impulsive growth. We are only a sharp drop away from confirming a big picture lower high for this bull market.
Historically, BTC doesn’t recover before the bear market. We need to have a big bullish candle above the ATH on high volume with some green days to follow to invalidate this thesis. If not, you can’t say I didn’t warn you. I’ve been spamming this market topping thesis since November 2024. I don’t really want a bear market, but I’d also like to not be so off on my analysis, haha.
🎯 Key Takeaways
BTC: Bullish momentum decreasing, with support at $95.7K-$98.3K and resistance at $107K-$110K. Consider breakout trades only above ATH.
ETH/ALTs: ALT rotation has played out. Focus only on ideal setups at critical resistance levels with tight stops. Avoid dip buying and chasing.
Strategy: Greed declining as macro conditions worsen. Maintain trailing stops, consider range trading between support/resistance, and prepare for potential bear market transition.
@ThePrivacySmurf