


#142: Go! Or are we stumbling off the blocks?
Hold your breath...

Not much has changed since last week. We are essentially back where we were before. The crypto market is really good at kicking the can down the road.
📌 TL;DR / Smurf’s Summary
Bitcoin is still consolidating in a range under the ATH of $112K and finding a bottom. ETH is packing into a tighter range. ETH & ALTs remain at risk of underperforming or falling in the short term. The market is in an active struggle for trend directionality.
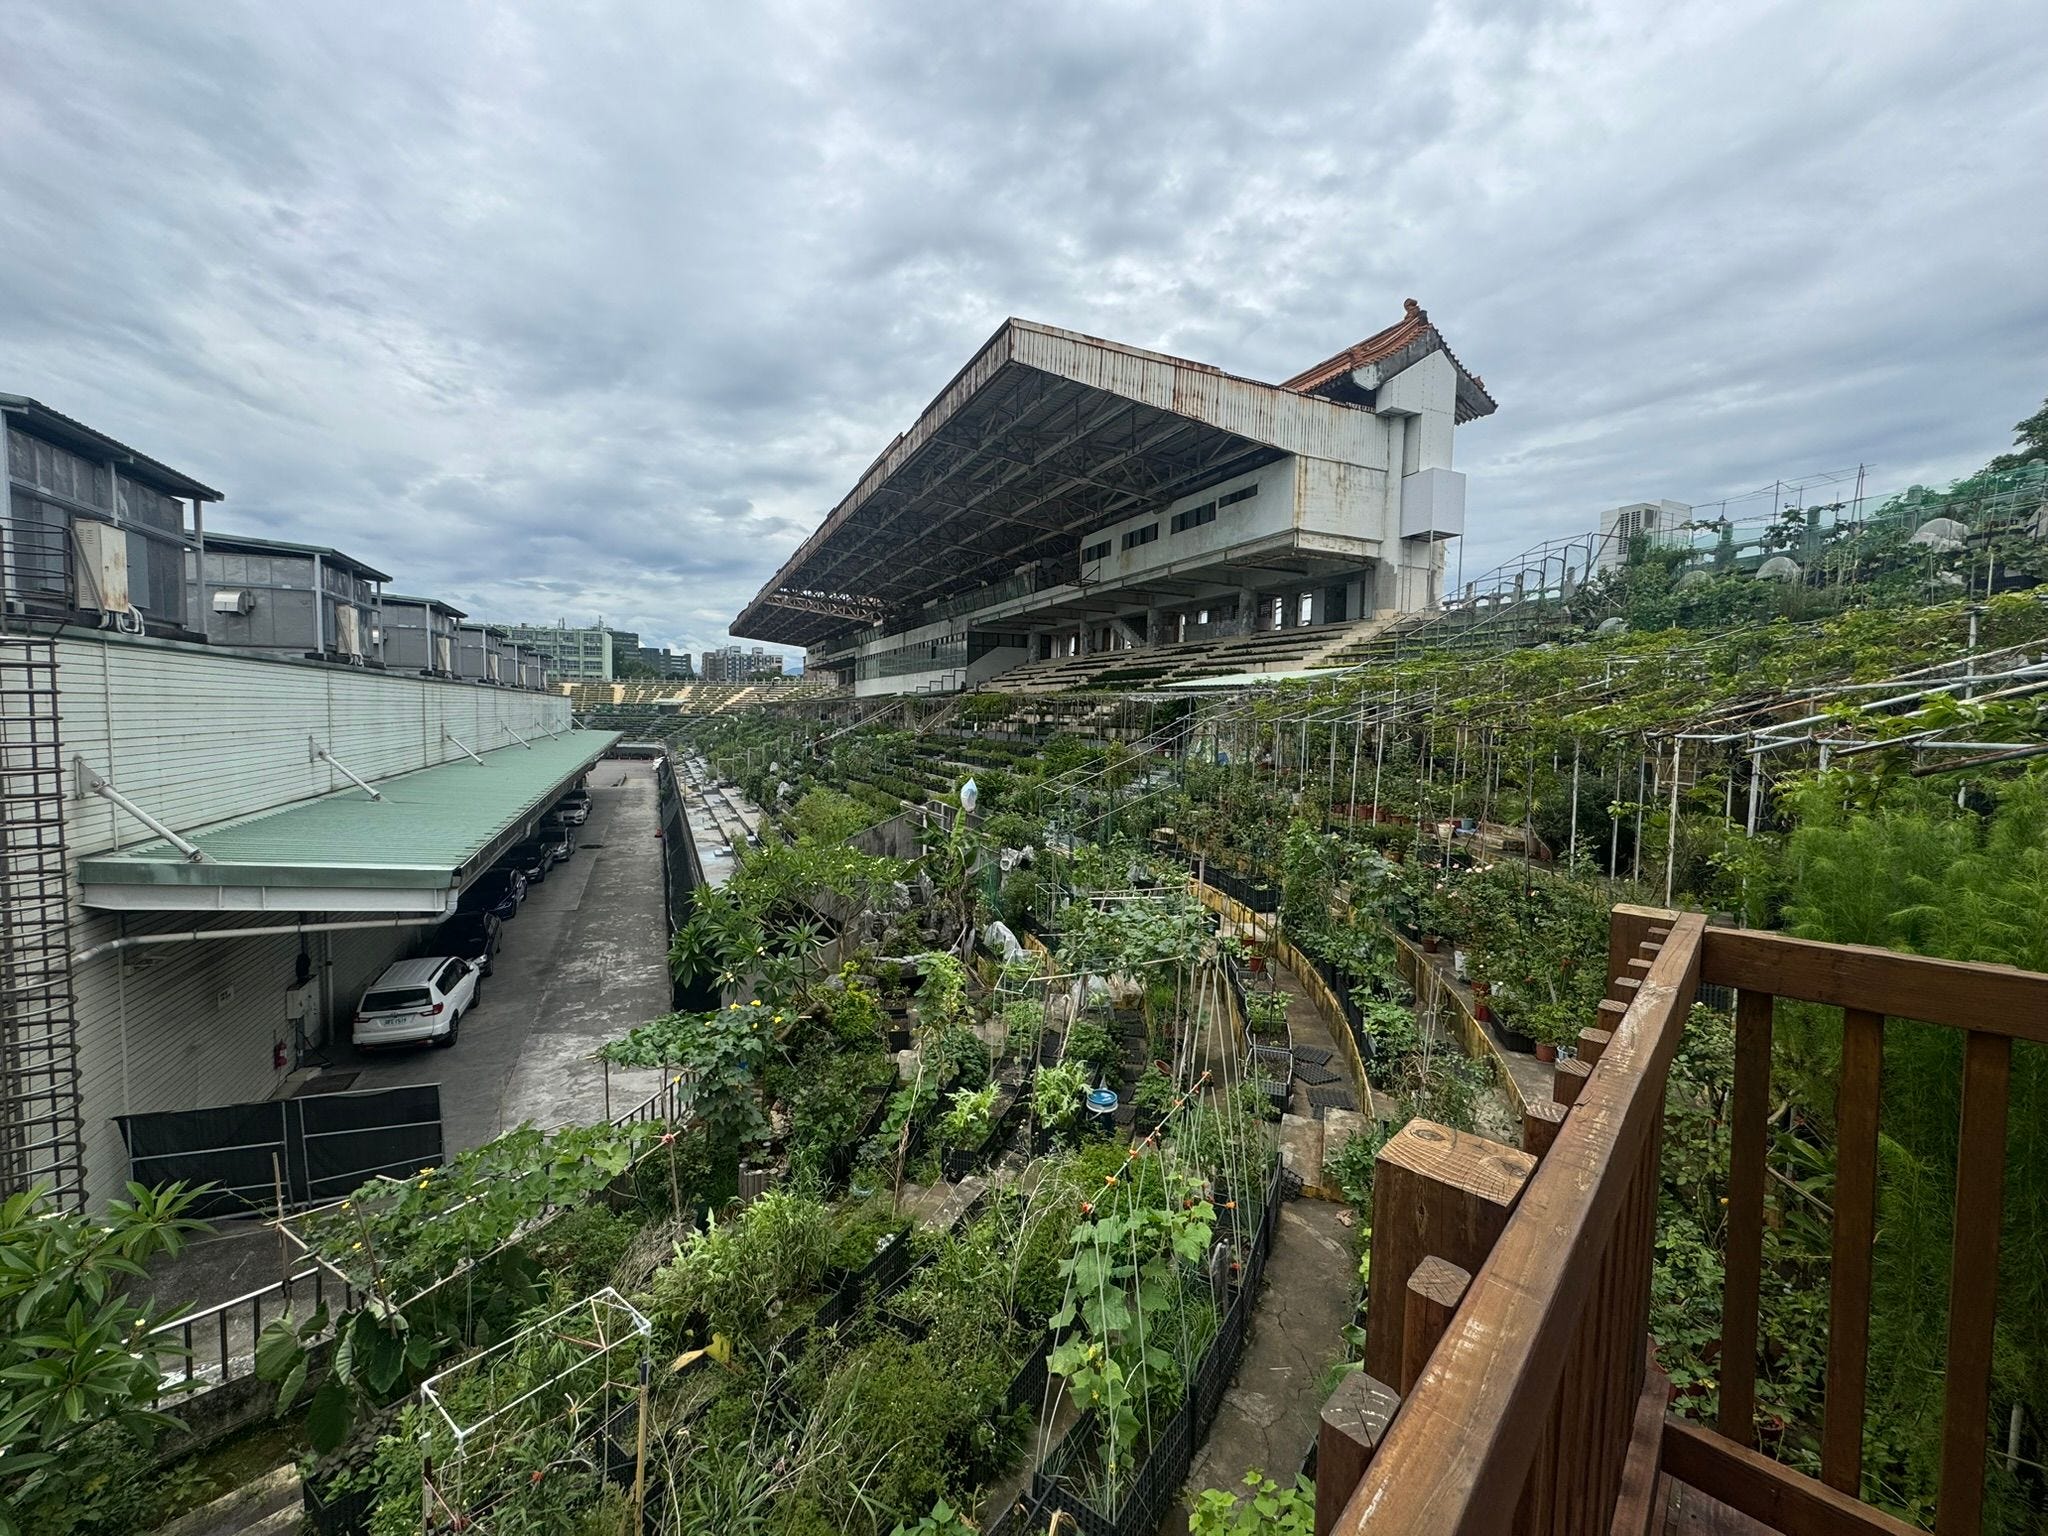
Pretty interesting thing here. Baseball is culturally more dominant in Taiwan. There was a decent-sized football (soccer) stadium in Taipei that was eventually converted to a subsidized public “farm.” All the supplies are provided, the growers just have to show up and do the work for their little “plot.” There’s even a weekly farmers market where they can sell what they’ve harvested.
What did you miss last week?
All my content is published for free. Paid subscriptions are a show of support for my work. If you appreciate what I do, consider a paid subscription and help me out by sharing or reposting my content.
🚦 Trader Traffic Light

BTC Trades: 🟠 → 🟡
Amber to Yellow Light. I’d consider a range trade from recent support to the ATH with tight stops under the recent low. Risk of downside is between medium and high, but closer to medium.
ETH & ALTs Trades: 🟠 → 🔴
Amber to Red Light. I’m not looking for any plays atm. It’s possible a few “ideal” setups exist but I’m on pause for the moment while prices stabilize. I’m still keeping a close eye on the altcoin market cap here. I will start looking for trades if BTC can manage to close over $109K.
🔍 Where Are We Now?
Market Structure: Bullish daily structure, short-term bearish momentum.
Retail Sentiment: Moderately Bullish.
Current Positioning:
BTC spot long at $78K, mostly scaled out with 33% remaining on trailing stop (trimmed profit: 1st @ $91.5K, 2nd @ $95.8K, 3rd @ $103.5K). No open leveraged position (price did meet required conditions last week but volume did not).
Only a couple ALT open positions left on trailing stops. Not considering new trades at the moment.
What are the Technicals?
Definitions you may not know:
Weekly Closing Range: Created with Bayesian statistics and linear regression. More on that here.
RSI (Relative Strength Index): Momentum indicator showing speed and power of price action.
Divergence: When price action is going one way but momentum is going the other, suggesting the current price trend might be losing power.
📈 Technical Deep Dive (BTC)
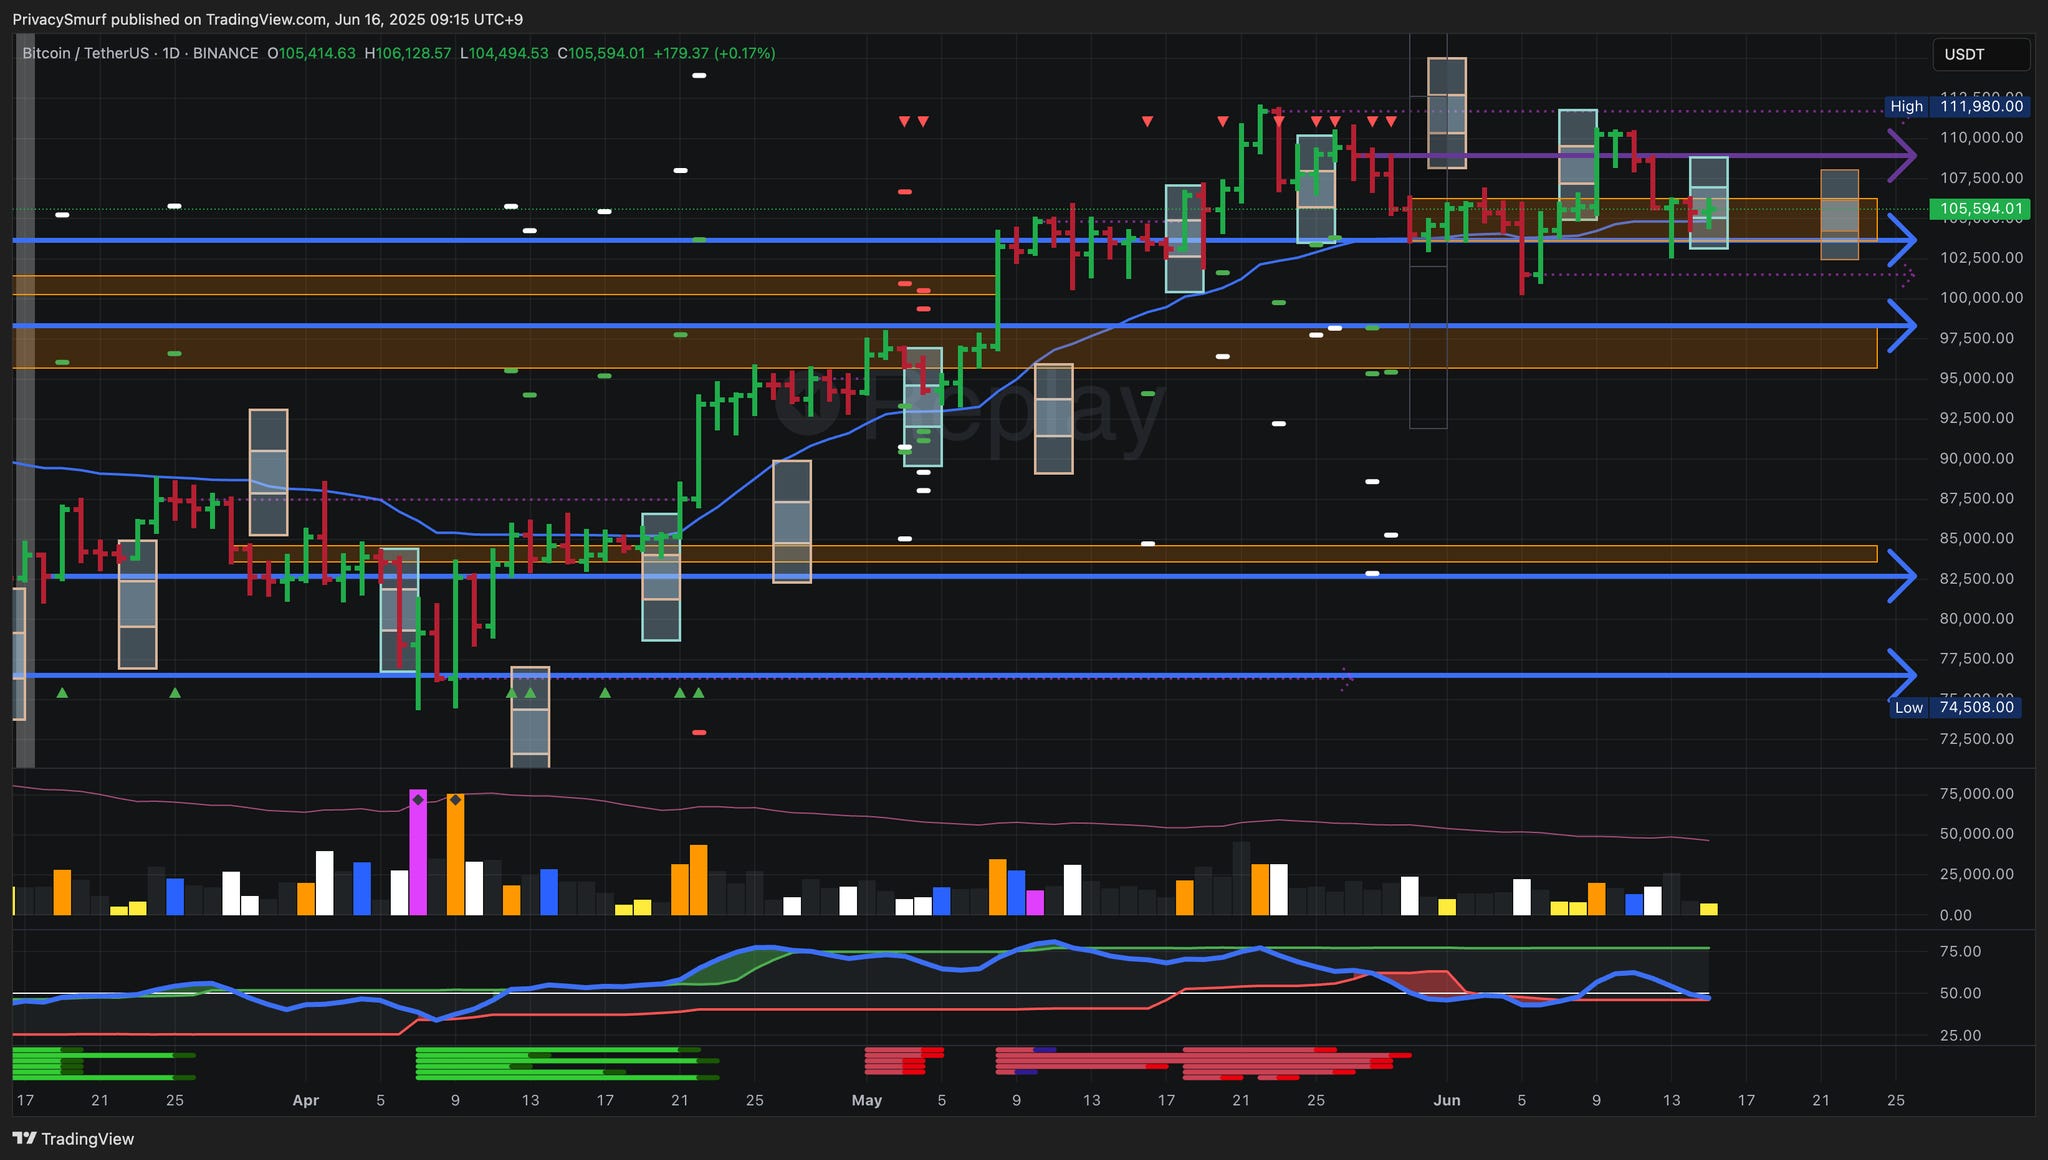
Price Action: Bullish Bias, defined consolidation range.
Support at $103.7K and $98.3K; Resistance around $108.9K and ATH @ $112K.
Weekly Closing Range is forecasted at $102.5K - $108.1K by Sunday.
Correctly projected 18 out of 33 (54.5% efficiency)
Monthly Closing Range is forecasted at $66.8K - $99.4K by Sunday.
Correctly projected 1 out of 1 (100% efficiency)
Indicators & Oscillators:
RSI: Suggesting continued price consolidation and/or possible bearish momentum shift because measurements are:
Wavering above and below the midline - there is a battle for control of price.
At the adaptive bottom band - breaking below suggests bearish impulsive price action could follow.
Divergence Signals: The remaining secondary target is at $98.1K. This presents as a swing low buying opportunity. If the RSI remains inside the bands this is a less likely target in the short term. While this target is a possible buy location it would be less appealing to me as the market structure would be in much worse shape and be nearing bearish confirmation.
📉 Technical Deep Dive (ETH & ALTs)
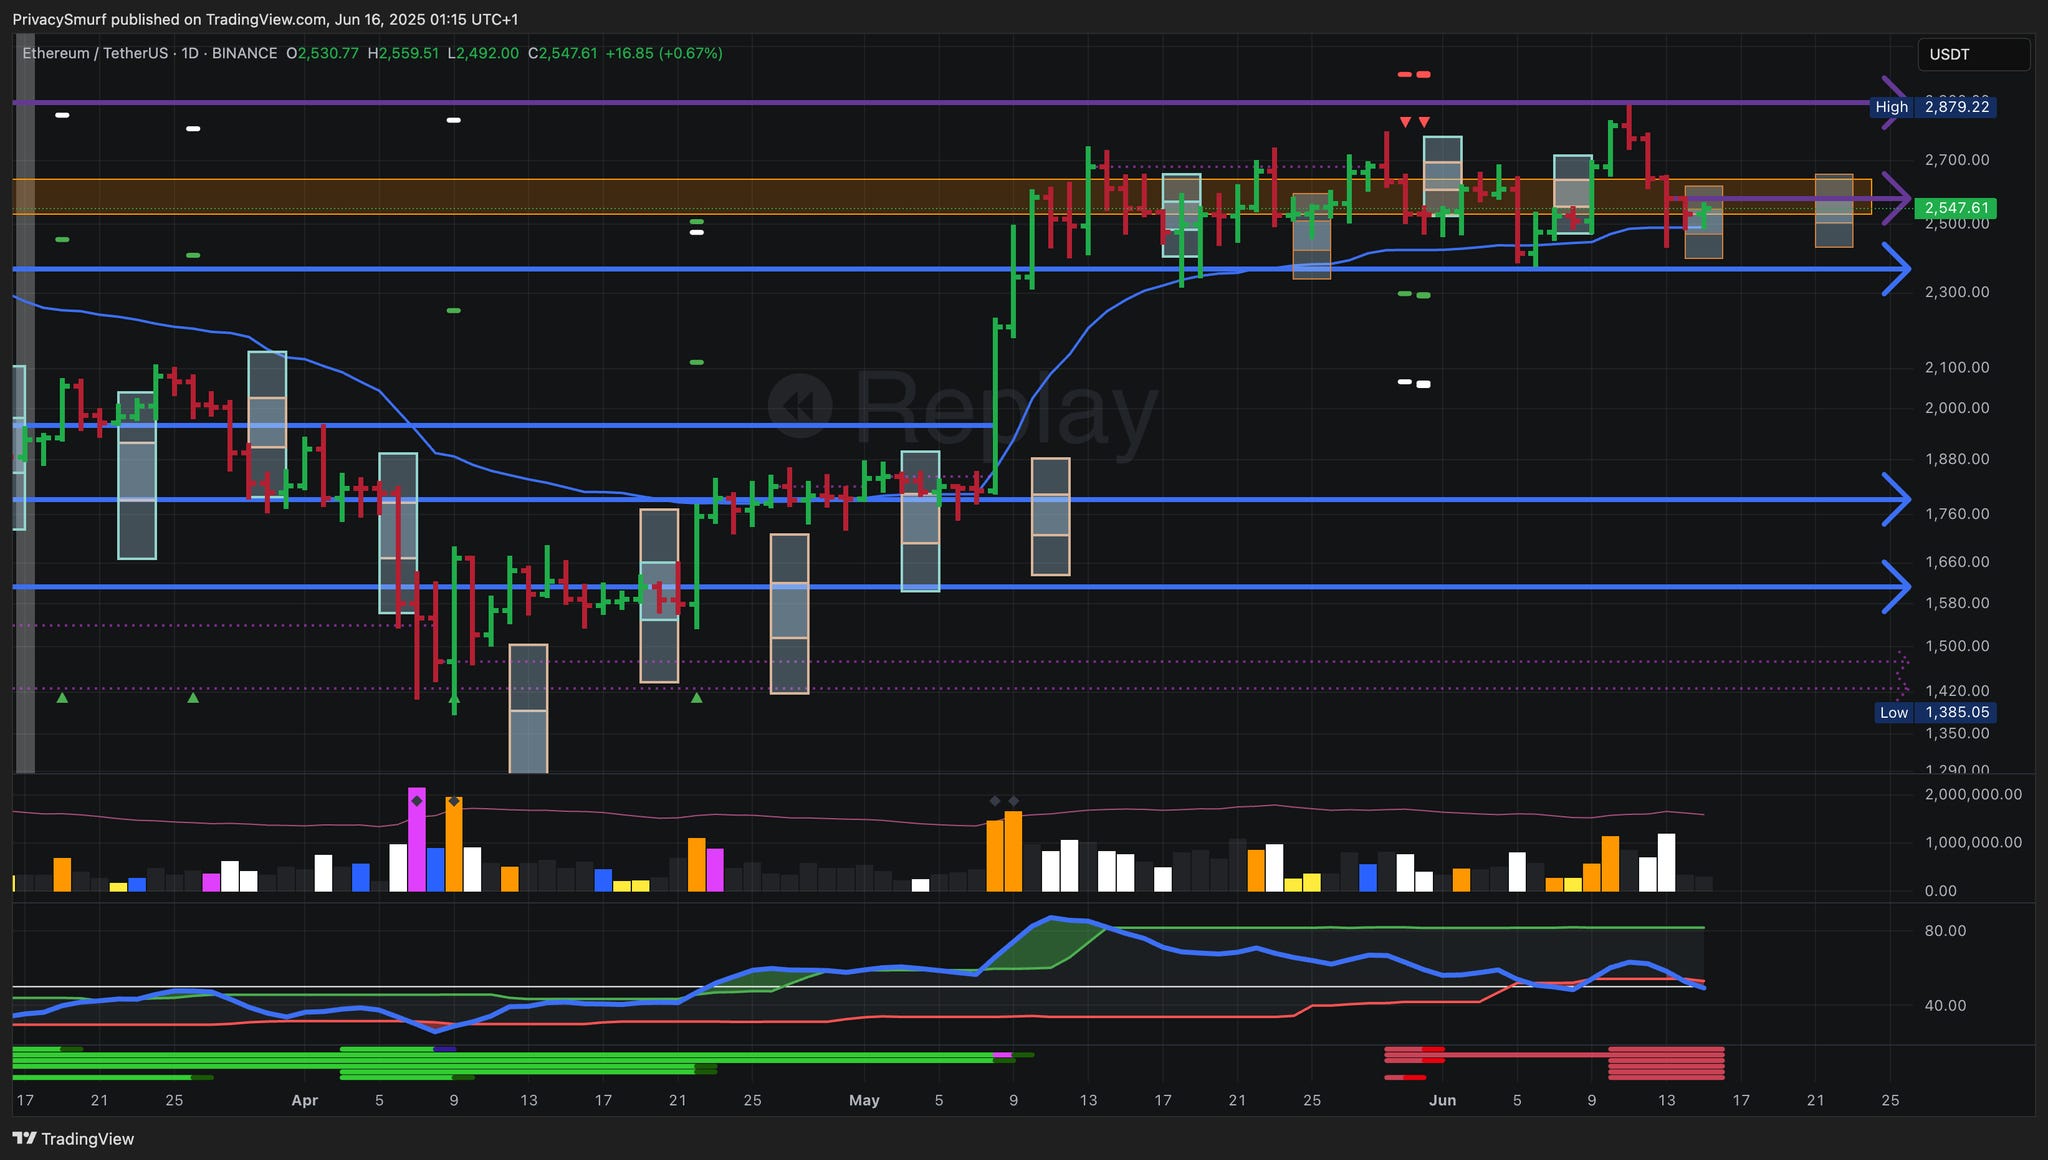
Price Action (ETH): Bullish Bias, defined consolidation range.
Support at $2320. Multiple defined resistances from $2530 - $2900.
Weekly Closing Range is forecasted at $2430 - $2655 by Sunday.
Correctly projected 17 out of 29 (58.6% efficiency)
Indicators & Oscillators (ETH):
RSI: Suggesting bearish price action because measurements are:
Currently below midline - momentum is generally bearish, it’s easier for prices to go down than up.
Currently below adaptive top band - price action is on a momentum breakdown to define a new floor.
Closing above the adaptive bottom band would mean bearish impulsive price action has ceased and a new floor may be established around the lowest close ~$2530.
Divergence Signals: The latest bearish signals with targets at around $2300 and $2065 remain active, though may not be hit in the short term if the RSI manages to close above the bottom adaptive band.
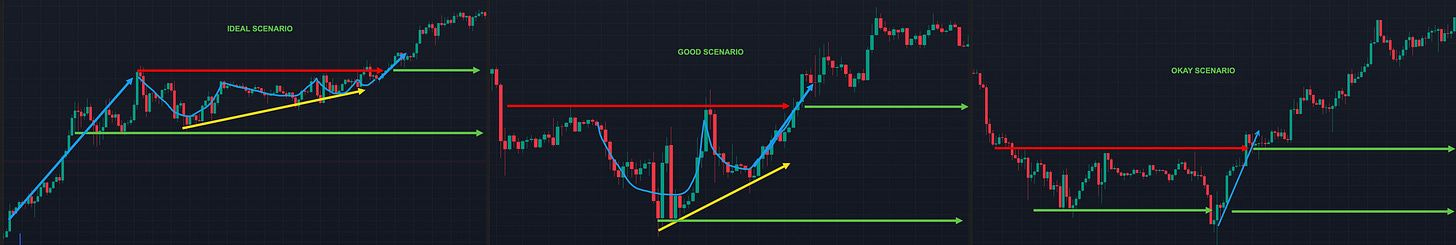
ALTs: I’m not interested in dip buying right now but an opportunity for a breakout may present itself if the bulls bring BTC back up over $109K. Another very short term rotation play could occur if that were to happen. I’ll leave this image of which chart pictures to focus on up for now but I imagine there are very few of them out there that still look like this. The ALT charts are mostly either down or consolidating right now. Caution is warranted, but keeping an eye out instead of shutting down the screen may present some rewarding tardes.
🧭 What’s the Plan?
**🧭 Trading Plan & Scenarios**

*   **Bullish - Momentum Breakout:**
    *   Condition: Close above $109K, RSI + 50, Vol > last 7 day's Vol
    *   Action: Leveraged long, Stop Loss under $104K
*   **Caution - BTC Consolidation:**
    *   Condition: $103K < Daily Closes < $113K
    *   Action: Consider short-term range trading, buy support & sell resistnace
*   **Bearish - BTC Bullish Invalidation:**
    *   Condition: Close < $92K
    *   Action: Close short-term spot BTC position
*   **Next ALT Rotation - (not this week?)**
    *   Condition: BTC $$ flat/down, BTC.D & Stable cap down, Mrkt Driver down     *   Action: Evaluate ALT breakouts
---

**📌 Spot Risk Management**

*   **Stop-Losses:**
    *   BTC: Daily close < $90K
    *   ALTs: Placement under clear pivot point ideally < 12% below entry
*   **Position Sizing:**
    *   BTC: Moderate to small entries
    *   ALTs: Small entries
🔮 My Long-Term Market Reflection

Macro Cycle Status:
Bull market still intact but in a phase that in the past lead to bear market confirmation unless we have daily closes for BTC above the all-time high, then things get tricky and not so clear-cut.
Historical Comparison:
Similar patterns to the prior bull market suggest caution; historically, failure to breach all-time highs before turning back down signaled bear market onset. As

Personal Expectations:
As time progresses without setting new highs, we continue to shape the market similarly to the last bull market. In a perfect mirroring scenario, we keep trending down eventually transitioning into a bear market. There would hypothetically be two weeks left before the bigger red candles start appearing.
The first cracks in this scenario have shown since we set a daily close higher than the June 3rd high. If we bounce here and close over the June 10 high it’s the second step towards bearish invalidation. Full invalidation would come with a new all time high close on the Total chart.
https://zenalyticstrading.substack.com/p/quarterly-market-synthesis-q2-2025
Taken from the post above, barring a decent 24-hour rally, the latest top timing window for BTC will be validated. We are almost through the bottom timing window from June 11 - June 16. So far (the ideal scenario) our lowest close in this window is above the $102K level from the prior bottom so we are retaining the textbook bullish shape (low, high, higher low, higher high) based solely on forecasts turning points. This constraint is suggesting price action between these waves is noise/less relevant. It is the random walk to the turning points.

In a perfect world we’ll trade and close higher than the May $111.7K top in the fast-approaching top timing window from June 17 - June 20, possibly invalidating the notion of a top. Failure to do so starts aligning with the bear thesis. It paints a picture of a lower high. That outcome would be moving in the wrong direction, creating the shape of a traditional bear trend transition (late May high, early June low, mid-to-late June lower high, early July lower low?).
🎯 Key Takeaways
BTC: Hope for best (ATH), plan for worst (breakdown). Buy near supports, sell near resistances.
OTHERS: Stand aside until dust settles and things are more clear.
@ThePrivacySmurf